


Fact Sheet
- Market: Abu Dhabi
- Symbol:ARAM
- ISIN:AES000601014
- Industry:Investments
ARAM Group seeks to provide the best services and achieve excellent levels of its operations and disclosures to create long-term sustainable value. We are dedicated to maximizing the shareholders’ value through committing to the corporate governance best practices in all operations.
Share Data
08/04/2026
KEY FIGURES
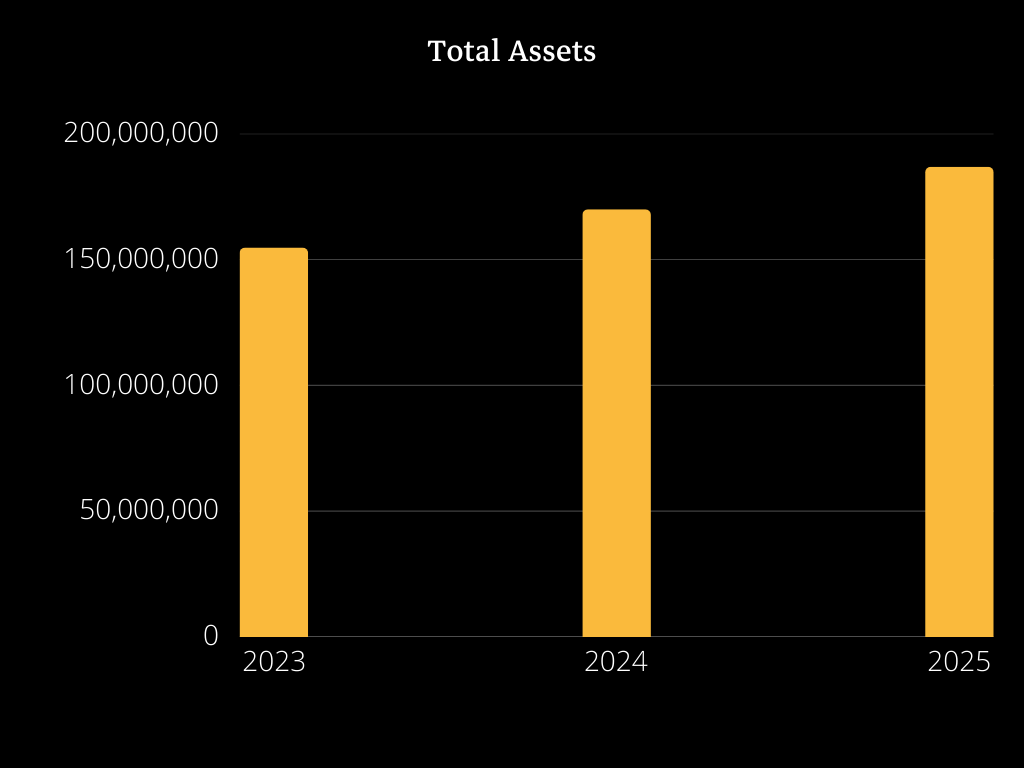
- 2025
- 2024
- 2023
INCOME STATEMENT
Revenue
11,236,419
Profit for the year
13,174,539
BALANCE SHEET
Total assets
186,810,334
Total liabilities
27,815,598
Total equity
158,994,736
CASH FLOW
Net cash generated from operating activities
5,280,110
Net cash (used in) generated from investing activities
(283,643)
Net cash used in financing activities
(5,237,828)
Cash and cash equivalents at the end of the year
448,996
KEY INDICATORS
Earnings per share (AED)
0.1670
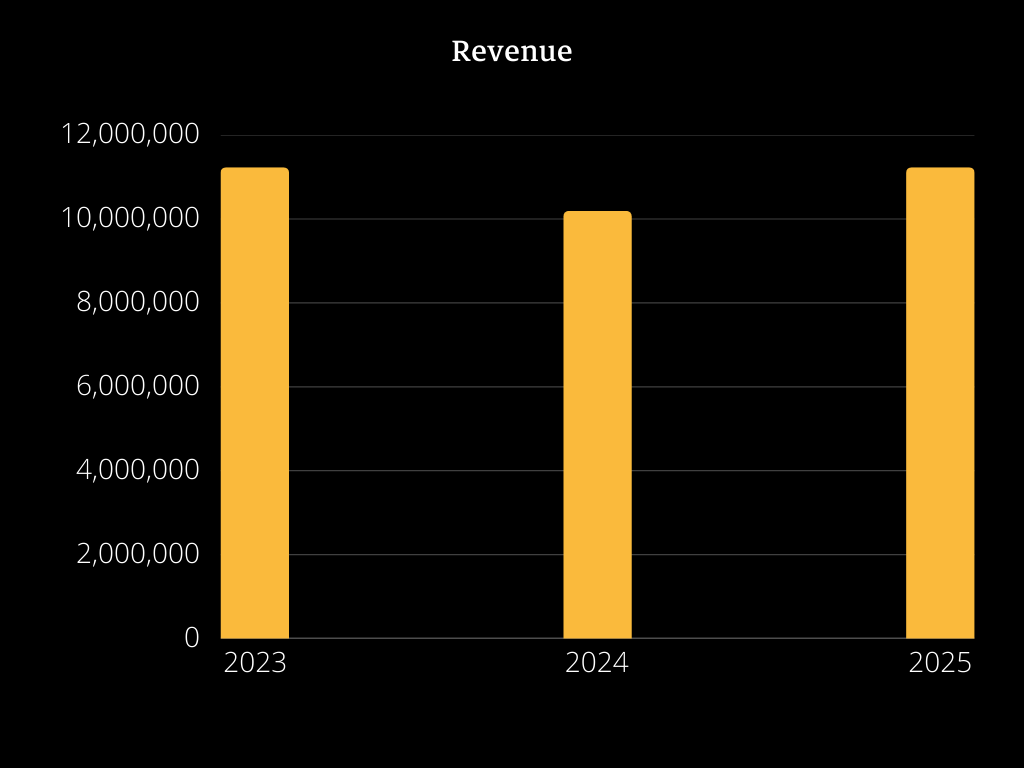
INCOME STATEMENT
Revenue
10,193,038
Profit for the year
16,696,855
BALANCE SHEET
Total assets
169,948,026
Total liabilities
30,338,161
Total equity
139,609,865
CASH FLOW
Net cash generated from operating activities
4,361,516
Net cash (used in) generated from investing activities
1,246,908
Net cash used in financing activities
(5,871,649)
Cash and cash equivalents at the end of the year
697,289
KEY INDICATORS
Earnings per share (AED)
0.2116
INCOME STATEMENT
Revenue
11,237,129
Profit for the year
4,393,652
BALANCE SHEET
Total assets
154,745,591
Total liabilities
31,739,656
Total equity
123,005,935
CASH FLOW
Net cash generated from operating activities
3,457,707
Net cash (used in) generated from investing activities
28,461,648
Net cash used in financing activities
(32,577,722)
Cash and cash equivalents at the end of the year
959,461
KEY INDICATORS
Earnings per share (AED)
0.0556